Heart Rate Variability: Why the Trend Matters More Than the Score
Heart rate variability is often presented as a single number on a wearable dashboard. That can make it look more definitive than it really is.
HRV describes the variation in timing between consecutive heartbeats. The heart does not beat at perfectly equal intervals, and that variation is influenced by the autonomic nervous system, which helps regulate responses to activity, recovery, stress, sleep, and other physiological demands.
For physicians, the useful part is rarely whether one reading is simply “high” or “low.” The more meaningful question is whether the value fits the patient’s normal pattern and whether that pattern is changing.
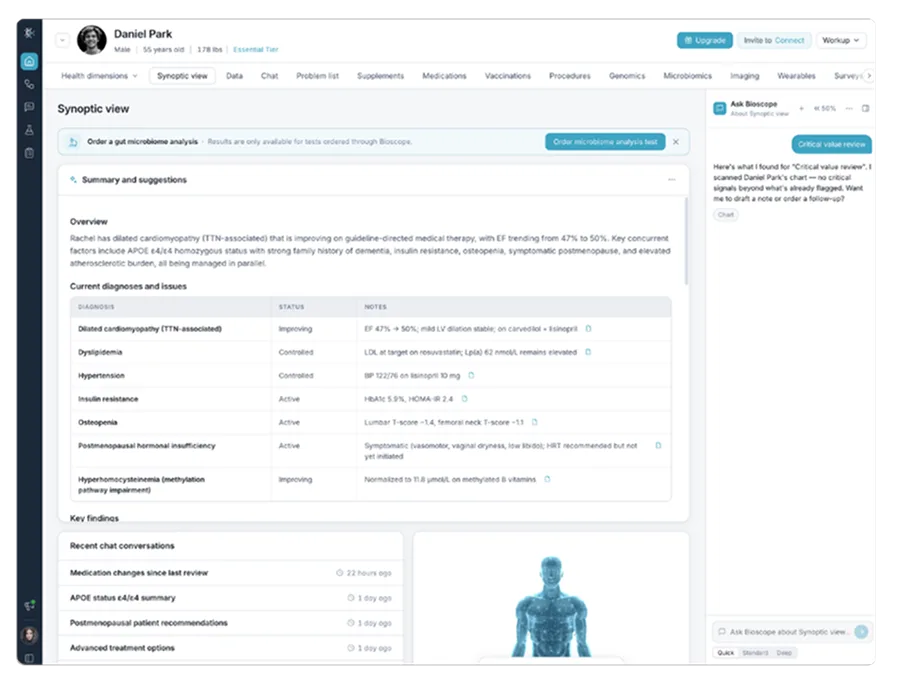
Bioscope.ai already supports HRV through its wearable-data model. The platform specifically lists HRV measured by RMSSD alongside steps, sleep, heart rate, SpO2, activity, and body-composition metrics from supported devices.
There Is No Universal “Good” HRV Number
One of the easiest mistakes to make with HRV is comparing one person directly with another. Heart rate variability can differ substantially between individuals. Age, fitness, sleep, medication use, cardiovascular health, training load, illness, stress, and many other factors can influence the number a wearable reports.
That means a value that is typical for one person may be unusual for someone else.
This is why an individual baseline can be more useful than a population comparison. If a patient usually has a relatively stable HRV pattern and that pattern changes meaningfully, the change may deserve more attention than the absolute number itself.
The emphasis shifts from asking, “Is this HRV good?” to asking, “Is this different for this patient?”
That is a more clinically responsible way to think about the metric.
Recovery Is a Pattern, Not a Daily Score
Wearables often frame HRV around recovery, but recovery is not a single physiological event.
Sleep, physical activity, illness, stress, travel, training, alcohol intake, medication changes, and other factors can all influence how the body responds from one day to the next.
A lower HRV reading after a demanding day does not automatically indicate a problem. Likewise, a higher reading does not prove that someone is fully recovered or in optimal health.
The surrounding circumstances matter.
When HRV is viewed over several days or weeks, patterns may become easier to interpret. A short-term fluctuation may disappear quickly. A persistent shift may prompt a closer look at sleep, activity, resting heart rate, symptoms, medication changes, or other clinical information.
That distinction is especially important in longevity-focused care, where the goal is often to understand the direction of change rather than react to every daily fluctuation.
Wearables Show What the Clinic Cannot See Every Day
Most clinical visits capture a limited window of a patient’s life.
Wearables create a different kind of record. They can collect information during sleep, exercise, work, travel, and ordinary daily routines, providing signals from the days and weeks between appointments.
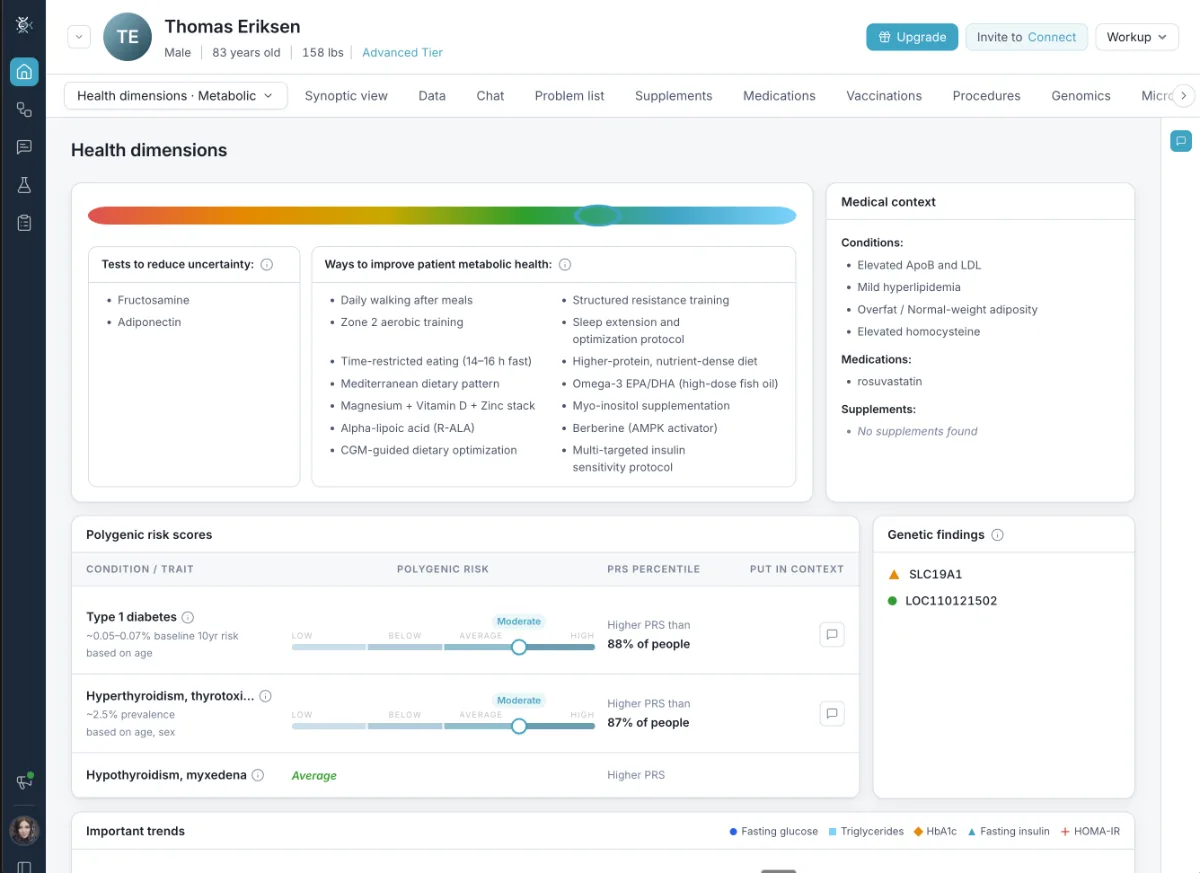
Bioscope.ai treats wearables as one of several patient-data streams, alongside genomics, microbiome information, imaging, and the medical record. Its Science page describes these sources as being modeled separately and then reasoned across together into a structured clinical view.
HRV fits naturally into that model because its value is often found in continuity.
The measurement can show how physiology changes when the patient is not in the clinic. But the number still needs context before it becomes clinically useful.
A Baseline Can Be More Valuable Than a Benchmark
Population reference ranges can be helpful in many areas of medicine, but HRV is highly individual.
A patient who has consistently had one range of HRV values may not benefit from being judged against another person’s baseline. The more informative comparison may be with their own historical pattern.
This makes longitudinal wearable data particularly valuable.
If HRV changes from the patient’s typical level, the physician can ask whether something else changed at the same time. Was sleep disrupted? Did training intensity increase? Was there an illness? Did resting heart rate shift? Was there a medication change?
The wearable cannot answer all of those questions by itself.
Its role is to make the pattern visible.
Where HRV Fits in Longevity Medicine
This is why HRV has a natural relationship with longevity medicine software.
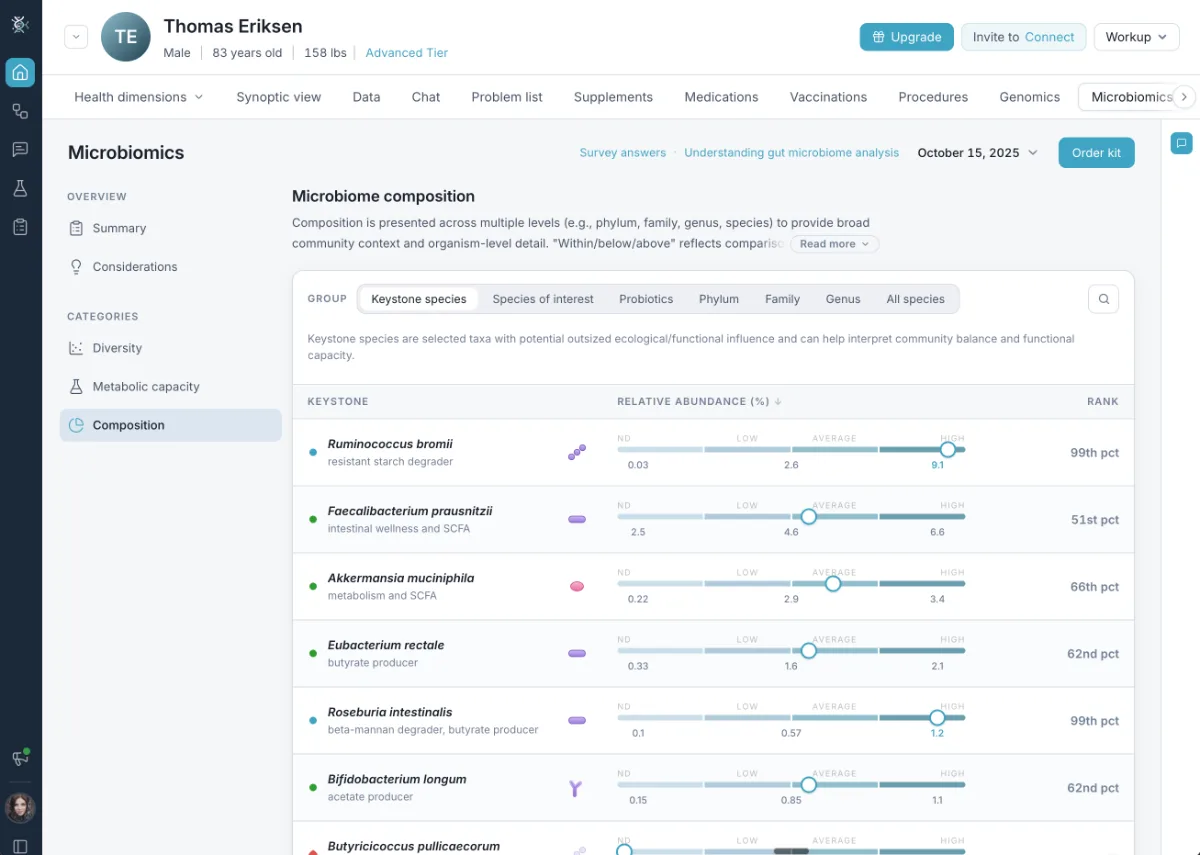
Longevity medicine often involves following several dimensions of health across time rather than focusing only on isolated episodes of care. Wearable-derived HRV can contribute to that longitudinal picture by showing one aspect of how the body responds to daily demands.
Its role should remain proportionate.
HRV does not define longevity, nor does one metric determine long-term health. It becomes more useful when considered with sleep, activity, cardiovascular measures, laboratory trends, body composition, medical history, and other relevant information.
The value comes from seeing how the pieces relate.
That is very different from treating the wearable score as an endpoint.
See Longevity Medicine Software in Action
Explore how Bioscope.ai brings wearables, labs, and records into one longitudinal view for longevity-focused physicians.
Schedule a DemoThe Problem With Too Much Wearable Data
Continuous health tracking creates a practical challenge: the more devices collect, the more information physicians may need to review.
A patient may arrive with months of sleep data, heart-rate trends, HRV, activity records, and other metrics. Reviewing those streams manually can add significant noise to an already complex clinical record.
This is where AI clinical workflow software becomes relevant.
Bioscope.ai positions its clinical workflow around organizing patient information, preparing for visits, and helping physicians review complex context more efficiently while keeping clinical judgment physician-led.
For HRV, that means the objective is not for AI to decide whether a value is good or bad.
The more practical role is helping place the trend next to other relevant information so the physician can decide whether it deserves attention.
HRV Should Not Be Interpreted Alone
A wearable can tell a physician that HRV changed. It cannot automatically explain why.
The reason may be obvious in some cases and uncertain in others.
Sleep disruption could be relevant. So could physical exertion, illness, psychological stress, medication use, travel, or changes in cardiovascular status. Sometimes a short-term shift may have little clinical significance at all.
That uncertainty is important.
HRV should therefore be treated as one signal within a larger health record, not as a diagnosis or a replacement for established clinical assessment.
This is consistent with Bioscope.ai’s broader approach to patient data. The platform is designed to bring multiple sources together, not to elevate one metric above everything else.
Review Complex Data Faster
Learn how AI clinical workflow software helps physicians prepare for visits while keeping clinical judgment in their hands.
Schedule a Personalized DemoWhy Context Changes the Meaning of the Same Number
The same HRV value can mean different things in different situations.
A reading after a period of intense training may need to be interpreted differently from the same value during an illness. A change that occurs alongside poor sleep may carry different context from a change seen alongside stable sleep and activity.
This is why clinical interpretation depends on relationships between data points.
HRV becomes more useful when the physician can see what happened before the change, what else changed at the same time, and whether the pattern persisted.
That turns the metric from a score into a clue.
And clues are most useful when they are connected.
A Better Way to Use HRV
The strongest use of heart rate variability is not chasing a target number every morning.
It is understanding the patient’s normal pattern and recognizing when that pattern changes.
Wearables make that possible by collecting repeated measurements outside the clinic. Bioscope.ai makes the data more useful by allowing wearable signals to sit alongside other patient information rather than remaining isolated in a consumer dashboard.
For physicians, that creates a more practical way to use HRV.
The metric can contribute information about recovery and physiological stress, but it remains one part of the broader patient story. The clinical value comes from the trend, the baseline, the surrounding evidence, and the physician’s interpretation of what those signals mean for the individual.
See Bioscope.ai in Your Practice
Book a walkthrough to see how Bioscope.ai places wearable trends like HRV next to the rest of your patient's clinical record.